Engineering and Mining Journal - Whether the market is copper, gold, nickel, iron ore, lead/zinc, PGM, diamonds or other commodities, E&MJ takes the lead in projecting trends, following development and reporting on the most efficient operating pr
Issue link: https://emj.epubxp.com/i/165843
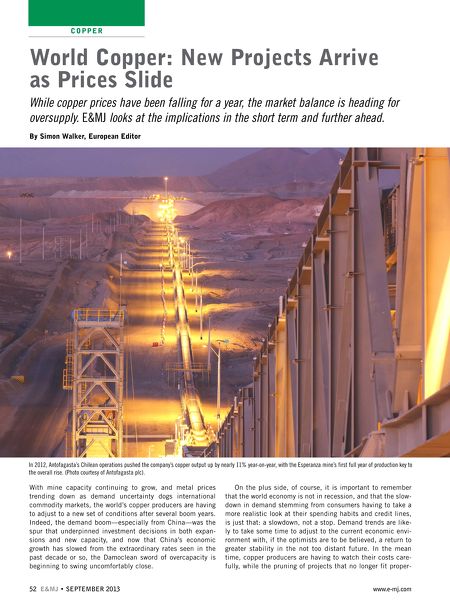
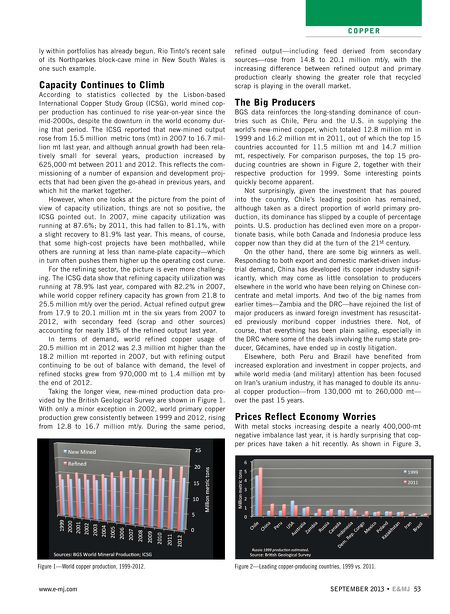
COPPER ly within portfolios has already begun. Rio Tinto's recent sale of its Northparkes block-cave mine in New South Wales is one such example. Capacity Continues to Climb According to statistics collected by the Lisbon-based International Copper Study Group (ICSG), world mined copper production has continued to rise year-on-year since the mid-2000s, despite the downturn in the world economy during that period. The ICSG reported that new-mined output rose from 15.5 million metric tons (mt) in 2007 to 16.7 million mt last year, and although annual growth had been relatively small for several years, production increased by 625,000 mt between 2011 and 2012. This reflects the commissioning of a number of expansion and development projects that had been given the go-ahead in previous years, and which hit the market together. However, when one looks at the picture from the point of view of capacity utilization, things are not so positive, the ICSG pointed out. In 2007, mine capacity utilization was running at 87.6%; by 2011, this had fallen to 81.1%, with a slight recovery to 81.9% last year. This means, of course, that some high-cost projects have been mothballed, while others are running at less than name-plate capacity—which in turn often pushes them higher up the operating cost curve. For the refining sector, the picture is even more challenging. The ICSG data show that refining capacity utilization was running at 78.9% last year, compared with 82.2% in 2007, while world copper refinery capacity has grown from 21.8 to 25.5 million mt/y over the period. Actual refined output grew from 17.9 to 20.1 million mt in the six years from 2007 to 2012, with secondary feed (scrap and other sources) accounting for nearly 18% of the refined output last year. In terms of demand, world refined copper usage of 20.5 million mt in 2012 was 2.3 million mt higher than the 18.2 million mt reported in 2007, but with refining output continuing to be out of balance with demand, the level of refined stocks grew from 970,000 mt to 1.4 million mt by the end of 2012. Taking the longer view, new-mined production data provided by the British Geological Survey are shown in Figure 1. With only a minor exception in 2002, world primary copper production grew consistently between 1999 and 2012, rising from 12.8 to 16.7 million mt/y. During the same period, Figure 1ÑWorld copper production, 1999-2012. www.e-mj.com refined output—including feed derived from secondary sources—rose from 14.8 to 20.1 million mt/y, with the increasing difference between refined output and primary production clearly showing the greater role that recycled scrap is playing in the overall market. The Big Producers BGS data reinforces the long-standing dominance of countries such as Chile, Peru and the U.S. in supplying the world's new-mined copper, which totaled 12.8 million mt in 1999 and 16.2 million mt in 2011, out of which the top 15 countries accounted for 11.5 million mt and 14.7 million mt, respectively. For comparison purposes, the top 15 producing countries are shown in Figure 2, together with their respective production for 1999. Some interesting points quickly become apparent. Not surprisingly, given the investment that has poured into the country, Chile's leading position has remained, although taken as a direct proportion of world primary production, its dominance has slipped by a couple of percentage points. U.S. production has declined even more on a proportionate basis, while both Canada and Indonesia produce less copper now than they did at the turn of the 21st century. On the other hand, there are some big winners as well. Responding to both export and domestic market-driven industrial demand, China has developed its copper industry significantly, which may come as little consolation to producers elsewhere in the world who have been relying on Chinese concentrate and metal imports. And two of the big names from earlier times—Zambia and the DRC—have rejoined the list of major producers as inward foreign investment has resuscitated previously moribund copper industries there. Not, of course, that everything has been plain sailing, especially in the DRC where some of the deals involving the rump state producer, Gécamines, have ended up in costly litigation. Elsewhere, both Peru and Brazil have benefited from increased exploration and investment in copper projects, and while world media (and military) attention has been focused on Iran's uranium industry, it has managed to double its annual copper production—from 130,000 mt to 260,000 mt— over the past 15 years. Prices Reflect Economy Worries With metal stocks increasing despite a nearly 400,000-mt negative imbalance last year, it is hardly surprising that copper prices have taken a hit recently. As shown in Figure 3, Figure 2ÑLeading copper-producing countries, 1999 vs. 2011. SEPTEMBER 2013 • E&MJ; 53