Engineering and Mining Journal - Whether the market is copper, gold, nickel, iron ore, lead/zinc, PGM, diamonds or other commodities, E&MJ takes the lead in projecting trends, following development and reporting on the most efficient operating pr
Issue link: https://emj.epubxp.com/i/378016
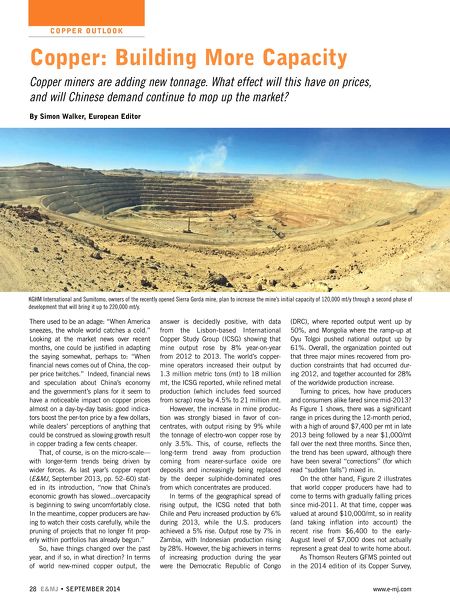
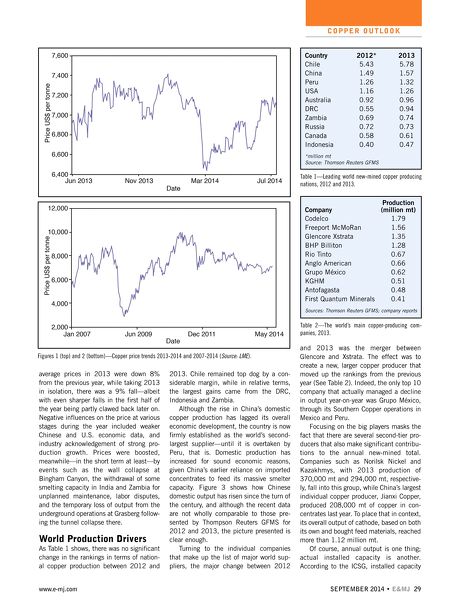
average prices in 2013 were down 8% from the previous year, while taking 2013 in isolation, there was a 9% fall—albeit with even sharper falls in the first half of the year being partly clawed back later on. Negative influences on the price at various stages during the year included weaker Chinese and U.S. economic data, and industry acknowledgement of strong pro- duction growth. Prices were boosted, meanwhile—in the short term at least—by events such as the wall collapse at Bingham Canyon, the withdrawal of some smelting capacity in India and Zambia for unplanned maintenance, labor disputes, and the temporary loss of output from the underground operations at Grasberg follow- ing the tunnel collapse there. World Production Drivers As Table 1 shows, there was no significant change in the rankings in terms of nation- al copper production between 2012 and 2013. Chile remained top dog by a con- siderable margin, while in relative terms, the largest gains came from the DRC, Indonesia and Zambia. Although the rise in China's domestic copper production has lagged its overall economic development, the country is now firmly established as the world's second- largest supplier—until it is overtaken by Peru, that is. Domestic production has increased for sound economic reasons, given China's earlier reliance on imported concentrates to feed its massive smelter capacity. Figure 3 shows how Chinese domestic output has risen since the turn of the century, and although the recent data are not wholly comparable to those pre- sented by Thompson Reuters GFMS for 2012 and 2013, the picture presented is clear enough. Turning to the individual companies that make up the list of major world sup- pliers, the major change between 2012 and 2013 was the merger between Glencore and Xstrata. The effect was to create a new, larger copper producer that moved up the rankings from the previous year (See Table 2). Indeed, the only top 10 company that actually managed a decline in output year-on-year was Grupo México, through its Southern Copper operations in Mexico and Peru. Focusing on the big players masks the fact that there are several second-tier pro- ducers that also make significant contribu- tions to the annual new-mined total. Companies such as Norilsk Nickel and Kazakhmys, with 2013 production of 370,000 mt and 294,000 mt, respective- ly, fall into this group, while China's largest individual copper producer, Jianxi Copper, produced 208,000 mt of copper in con- centrates last year. To place that in context, its overall output of cathode, based on both its own and bought feed materials, reached more than 1.12 million mt. Of course, annual output is one thing; actual installed capacity is another. According to the ICSG, installed capacity SEPTEMBER 2014 • E&MJ; 29 www.e-mj.com C O P P E R O U T LO O K Table 1—Leading world new-mined copper producing nations, 2012 and 2013. Figures 1 (top) and 2 (bottom)—Copper price trends 2013-2014 and 2007-2014 ( Source: LME ). Country 2012* 2013 Chile 5.43 5.78 China 1.49 1.57 Peru 1.26 1.32 USA 1.16 1.26 Australia 0.92 0.96 DRC 0.55 0.94 Zambia 0.69 0.74 Russia 0.72 0.73 Canada 0.58 0.61 Indonesia 0.40 0.47 *million mt Source: Thomson Reuters GFMS Table 2—The world's main copper-producing com- panies, 2013. Production Company (million mt) Codelco 1.79 Freeport McMoRan 1.56 Glencore Xstrata 1.35 BHP Billiton 1.28 Rio Tinto 0.67 Anglo American 0.66 Grupo México 0.62 KGHM 0.51 Antofagasta 0.48 First Quantum Minerals 0.41 Sources: Thomson Reuters GFMS; company reports