Engineering and Mining Journal - Whether the market is copper, gold, nickel, iron ore, lead/zinc, PGM, diamonds or other commodities, E&MJ takes the lead in projecting trends, following development and reporting on the most efficient operating pr
Issue link: https://emj.epubxp.com/i/981569
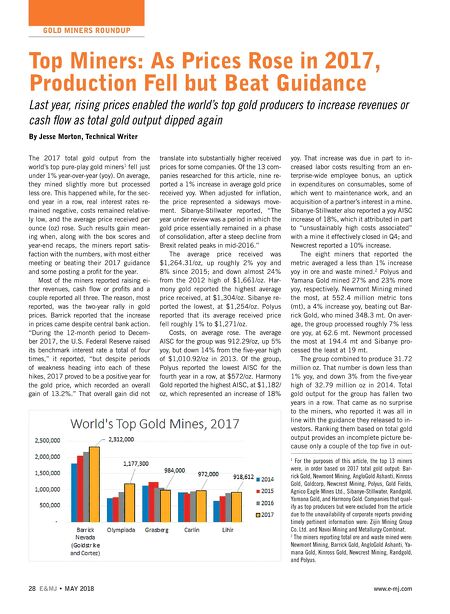
GOLD MINERS ROUNDUP 28 E&MJ; • MAY 2018 www.e-mj.com The 2017 total gold output from the world's top pure-play gold miners 1 fell just under 1% year-over-year (yoy). On average, they mined slightly more but processed less ore. This happened while, for the sec- ond year in a row, real interest rates re- mained negative, costs remained relative- ly low, and the average price received per ounce (oz) rose. Such results gain mean- ing when, along with the box scores and year-end recaps, the miners report satis- faction with the numbers, with most either meeting or beating their 2017 guidance and some posting a profit for the year. Most of the miners reported raising ei- ther revenues, cash flow or profits and a couple reported all three. The reason, most reported, was the two-year rally in gold prices. Barrick reported that the increase in prices came despite central bank action. "During the 12-month period to Decem- ber 2017, the U.S. Federal Reserve raised its benchmark interest rate a total of four times," it reported, "but despite periods of weakness heading into each of these hikes, 2017 proved to be a positive year for the gold price, which recorded an overall gain of 13.2%." That overall gain did not translate into substantially higher received prices for some companies. Of the 13 com- panies researched for this article, nine re- ported a 1% increase in average gold price received yoy. When adjusted for inflation, the price represented a sideways move- ment. Sibanye-Stillwater reported, "The year under review was a period in which the gold price essentially remained in a phase of consolidation, after a steep decline from Brexit related peaks in mid-2016." The average price received was $1,264.31/oz, up roughly 2% yoy and 8% since 2015; and down almost 24% from the 2012 high of $1,661/oz. Har- mony gold reported the highest average price received, at $1,304/oz. Sibanye re- ported the lowest, at $1,254/oz. Polyus reported that its average received price fell roughly 1% to $1,271/oz. Costs, on average rose. The average AISC for the group was 912.29/oz, up 5% yoy, but down 14% from the five-year high of $1,010.92/oz in 2013. Of the group, Polyus reported the lowest AISC for the fourth year in a row, at $572/oz. Harmony Gold reported the highest AISC, at $1,182/ oz, which represented an increase of 18% yoy. That increase was due in part to in- creased labor costs resulting from an en- terprise-wide employee bonus, an uptick in expenditures on consumables, some of which went to maintenance work, and an acquisition of a partner's interest in a mine. Sibanye-Stillwater also reported a yoy AISC increase of 18%, which it attributed in part to "unsustainably high costs associated" with a mine it effectively closed in Q4; and Newcrest reported a 10% increase. The eight miners that reported the metric averaged a less than 1% increase yoy in ore and waste mined. 2 Polyus and Yamana Gold mined 27% and 23% more yoy, respectively. Newmont Mining mined the most, at 552.4 million metric tons (mt), a 4% increase yoy, beating out Bar- rick Gold, who mined 348.3 mt. On aver- age, the group processed roughly 7% less ore yoy, at 62.6 mt. Newmont processed the most at 194.4 mt and Sibanye pro- cessed the least at 19 mt. The group combined to produce 31.72 million oz. That number is down less than 1% yoy, and down 3% from the five-year high of 32.79 million oz in 2014. Total gold output for the group has fallen two years in a row. That came as no surprise to the miners, who reported it was all in line with the guidance they released to in- vestors. Ranking them based on total gold output provides an incomplete picture be- cause only a couple of the top five in out- Top Miners: As Prices Rose in 2017, Production Fell but Beat Guidance Last year, rising prices enabled the world's top gold producers to increase revenues or cash flow as total gold output dipped again By Jesse Morton, Technical Writer 1 For the purposes of this article, the top 13 miners were, in order based on 2017 total gold output: Bar- rick Gold, Newmont Mining, AngloGold Ashanti, Kinross Gold, Goldcorp, Newcrest Mining, Polyus, Gold Fields, Agnico Eagle Mines Ltd., Sibanye-Stillwater, Randgold, Yamana Gold, and Harmony Gold. Companies that qual- ify as top producers but were excluded from the article due to the unavailability of corporate reports providing timely pertinent information were: Zijin Mining Group Co. Ltd. and Navoi Mining and Metallurgy Combinat. 2 The miners reporting total ore and waste mined were: Newmont Mining, Barrick Gold, AngloGold Ashanti, Ya- mana Gold, Kinross Gold, Newcrest Mining, Randgold, and Polyus.