NIOSH VIBRATION
44 E&MJ; • MAY 2018 www.e-mj.com
www.Derrick.com
Derrick W56 Trash Screen removing carbon at 600 microns
Increase Gold Recovery, Reduce Costs, Improve
Performance & Efficiency, and Equipment Reliability
Derrick
®
offers solutions for fine screening in gold processing plants that effectively address
all of these objectives. Whether your application is cyclone overflow trash duty, tailings carbon
safety, in-tank interstage carbon retention, de-gritting, loaded carbon, carbon sizing, carbon
dewatering, gravity separation, or carbon column safety, Derrick has a proven solution for
you. Derrick screening machines – equipped with long-lasting, non-blinding Polyweb
®
urethane
surfaces – offer the highest screen throughput in the smallest available footprint.
D E R R I C K
®
U R E T H A N E S C R E E N S
®
Contact Derrick today to discover how you can increase efficiency and profits!
been clearly documented. Those levels
within the HGCZ indicate caution with
respect to potential health risks. The
exposure limit value (ELV) is the level
above which health risks are likely. Ta-
bles 1 and 2 display the EAVs and ELVs
in terms of aw and VDV.
Results
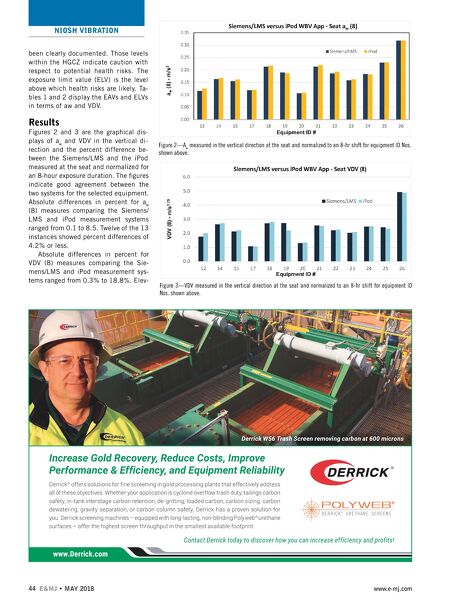
Figures 2 and 3 are the graphical dis-
plays of a
w
and VDV in the vertical di-
rection and the percent difference be-
tween the Siemens/LMS and the iPod
measured at the seat and normalized for
an 8-hour exposure duration. The figures
indicate good agreement between the
two systems for the selected equipment.
Absolute differences in percent for a
w
(8) measures comparing the Siemens/
LMS and iPod measurement systems
ranged from 0.1 to 8.5. Twelve of the 13
instances showed percent differences of
4.2% or less.
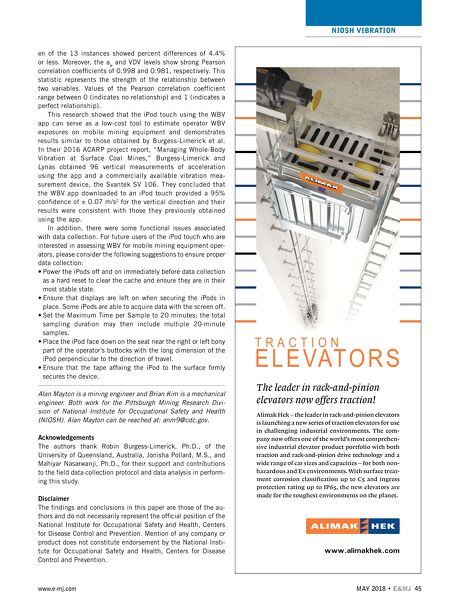
Absolute differences in percent for
VDV (8) measures comparing the Sie-
mens/LMS and iPod measurement sys-
tems ranged from 0.3% to 18.8%. Elev-
Figure 2—A
w
measured in the vertical direction at the seat and normalized to an 8-hr shift for equipment ID Nos.
shown above.
Figure 3—VDV measured in the vertical direction at the seat and normalized to an 8-hr shift for equipment ID
Nos. shown above.